This is a discovery more than a solution. OBIEE 11g lets us use Hierarchical column as dimensional attributes for charts.
Using hierarchical columns in chart enables us to create drill-able charts. The default view can be the top level view and the user can then drill to a more granular view in the chart on the fly.
Consider the following Analysis. I have dragged hierarchical time dimension column and a measure column. I have created a tabular and a graph view on top of these 2 columns.
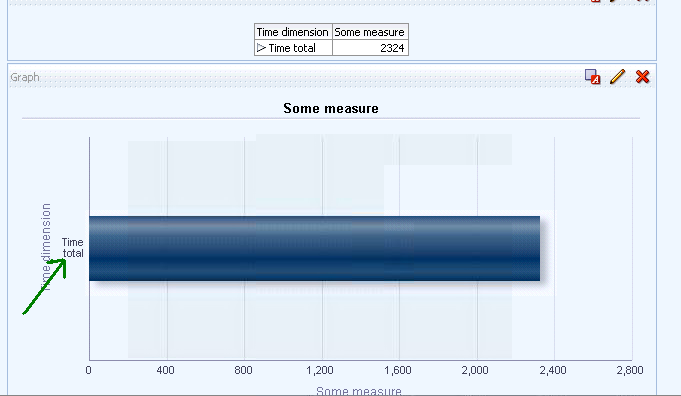
Note that the Time total label (highlighted in the above screenshot) is drill-able.
We can see the following week end dates if we drill from 'Time total' label.

3 comments:
Hi! I have tried this but when you have drilled down to detail level, how to you "drill-up" or go back to initial graph? There's no back button.
Vishal Pathak,
Can you post complete steps, I tried but no working for me.
Regards,
Its a feature not a solution so no steps for this. Hierarchical columns can be used for drill down in charts.
Post a Comment